Where to build next: choosing Nigeria's next connectivity sites
Nigeria's broadband plan sets minimum speeds of 25 Mbps in towns and 10 Mbps in rural areas, but money for new sites is scarce and the gaps are not all the same. I sorted every populated square kilometre of the country by what it needs, then chose which clinics and schools should host new sites so that each one reaches as many unconnected people as possible.
- People mapped
- 205.6 M
- In rural gaps
- 66.0 M
- Reached by the first 100 sites
- 3.12 M
- Numbers rechecked
- 40 of 40
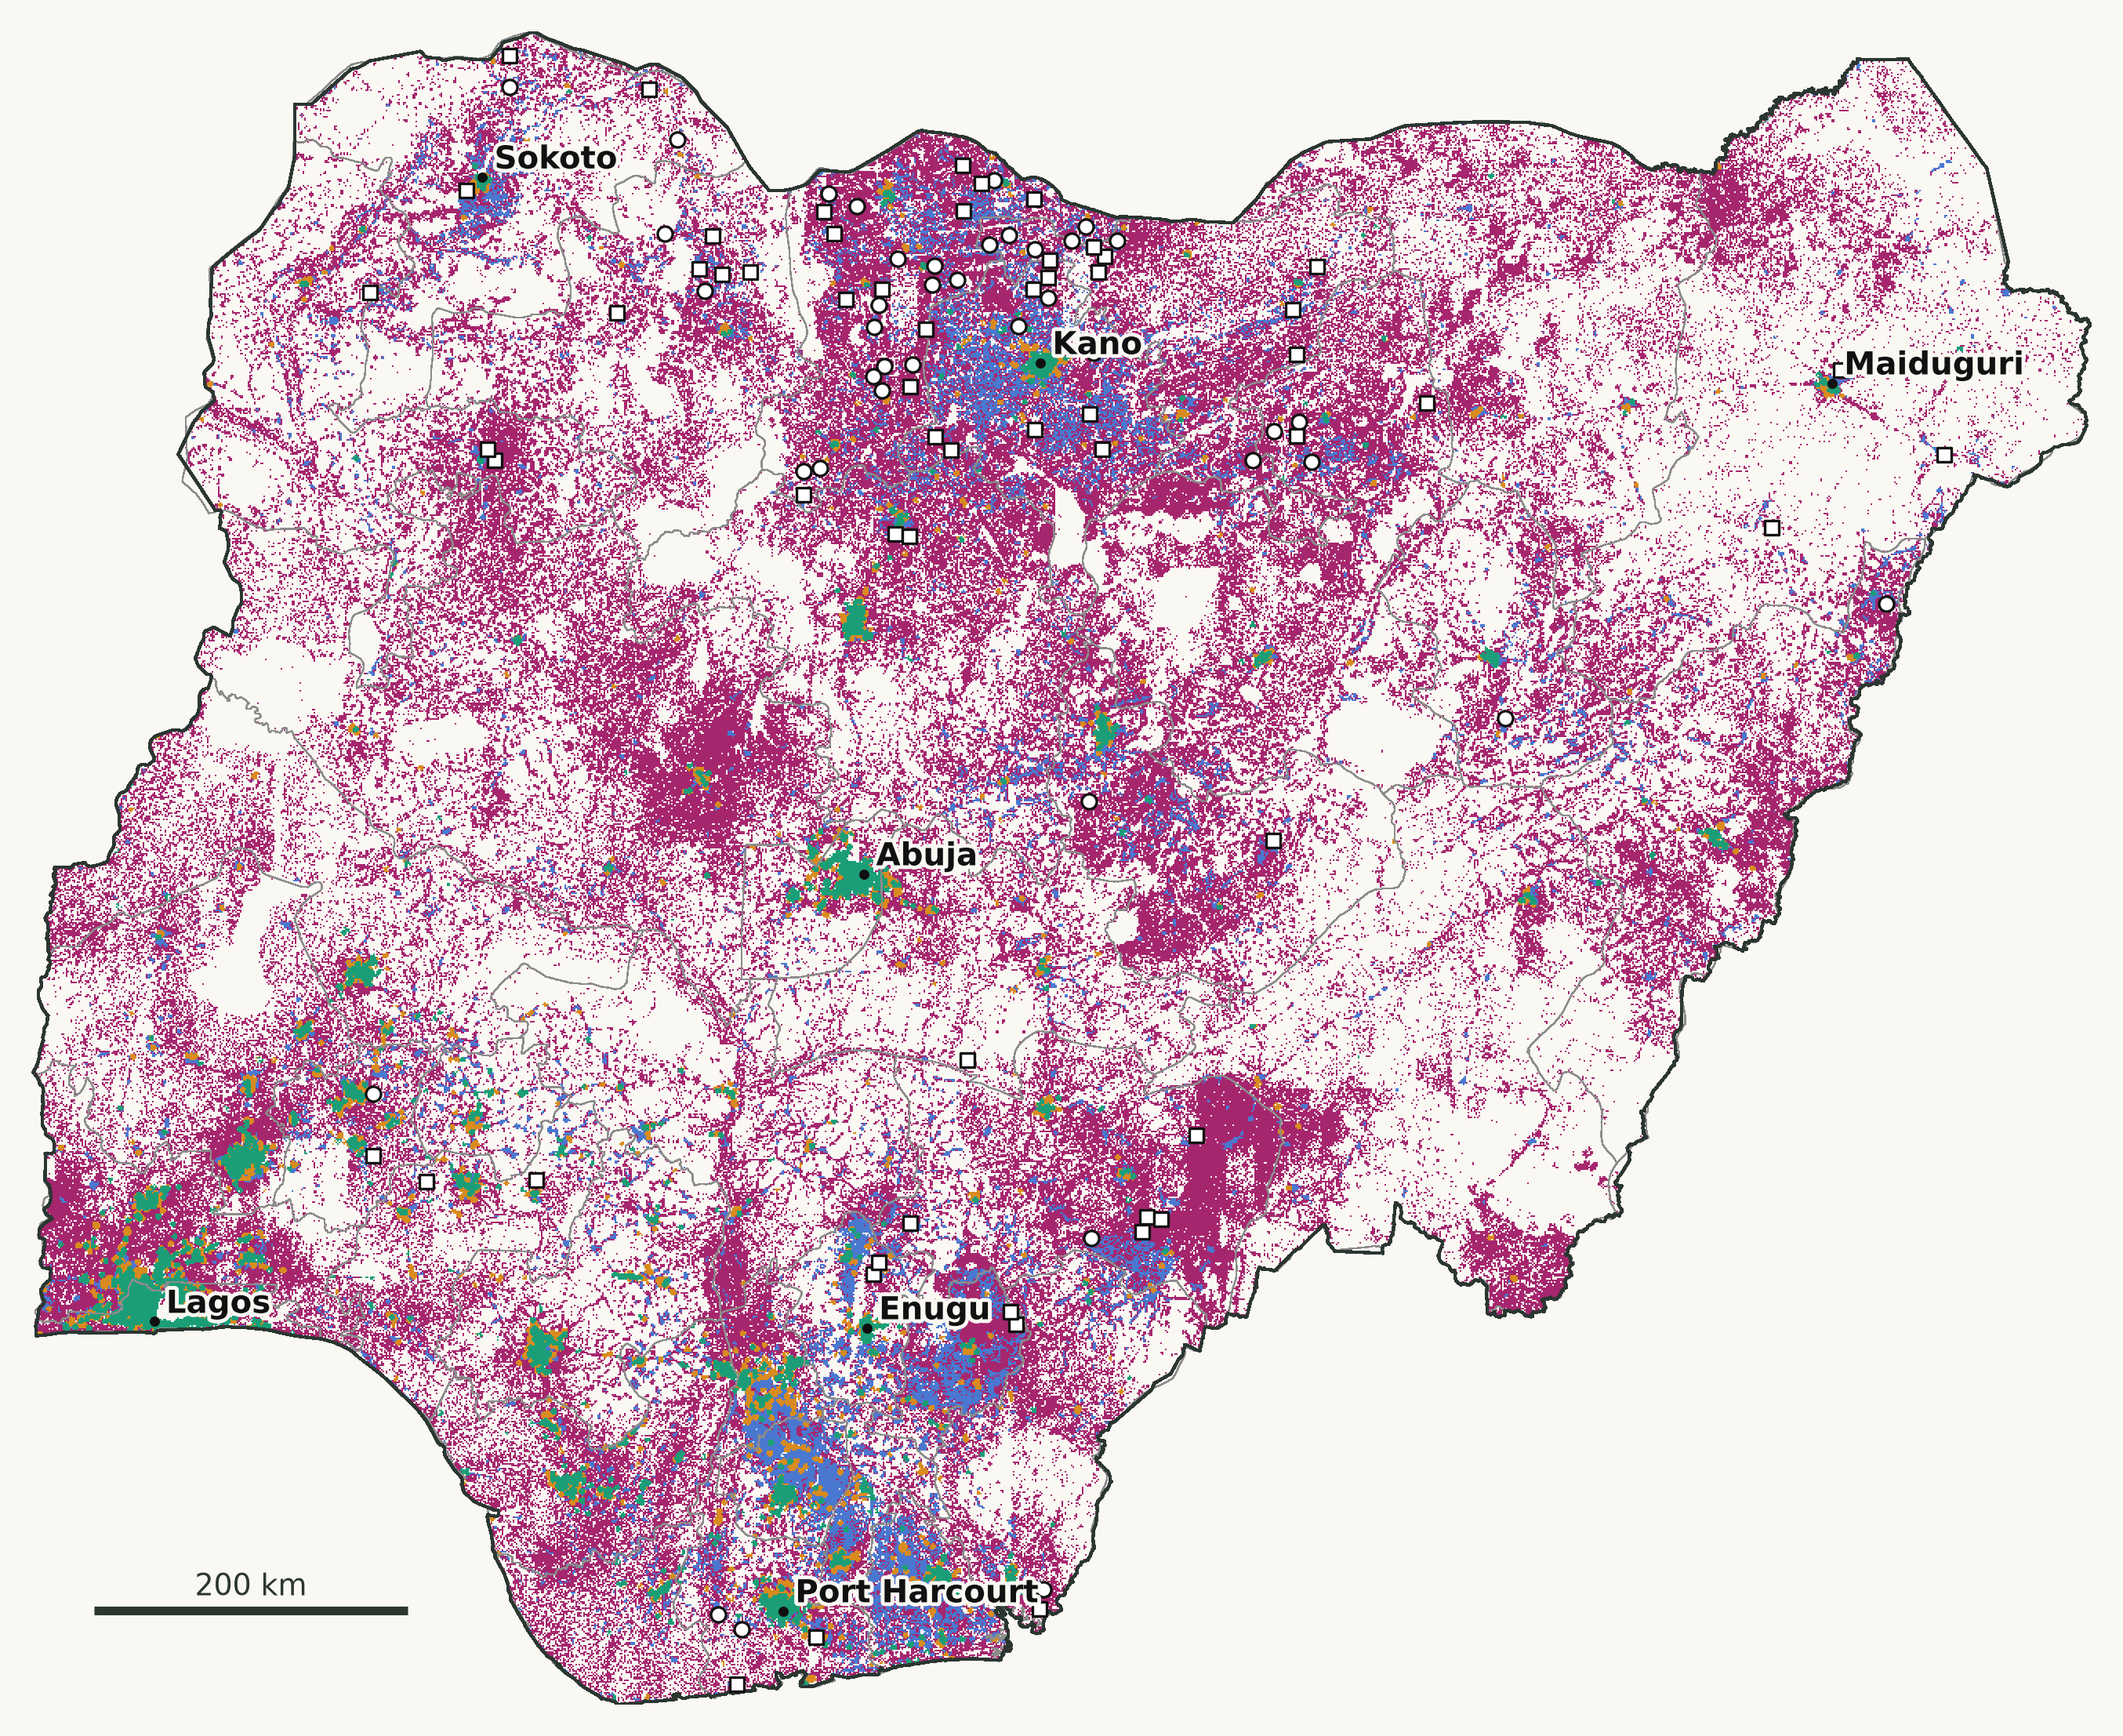 Enlarge map
- Served: a test at the plan's speed within 2 km 53.0 M
- Slow signal: tests nearby, all below the plan's speed 22.1 M
- Town to measure: no test within 2 km 64.6 M
- Rural gap: no test within 2 km 66.0 M
- Clinic chosen as a site
- School chosen as a site
Based on Oluwasola Oyinloye's analysis of Speedtest® by Ookla® Global Fixed and Mobile Network Performance Maps for Q4 2024. Ookla trademarks used under license and reprinted with permission. Map licensed CC BY-NC-SA 4.0. Other layers: Meta population and Relative Wealth Index, GHSL, GRID3, OCHA.
The question
Where does a new connectivity site do the most good? And where is the real problem something else: networks that exist but are slow, or places nobody has measured yet? I built this for the Geospatial Track of the DSN AI Bootcamp 2026, whose brief was to map Nigeria's digital divide.
Four needs, not one
Using Ookla's mobile speed tests for October to December 2024, each populated square kilometre gets one of four labels, depending on whether a test within 2 km reaches the plan's speed for that setting:
- Served: 53.0 M peopleA test at the plan's speed within 2 km. Nothing new is needed.
- Slow signal: 22.1 MTests nearby, all below the plan's speed. The fix is more capacity on existing networks.
- Town to measure: 64.6 MUrban, but no test within 2 km. Measure before investing.
- Rural gap: 66.0 MRural, with no test within 2 km. This is where new sites are needed.
80.5% of the people in rural gaps are in Nigeria's poorer 40%, by Meta's Relative Wealth Index. Where people do test, the average mobile download is 52.2 Mbps in towns and 22.9 Mbps in rural areas, but only 628 of the 9,234 tiles with tests are rural.
Choosing the sites
Existing clinics and schools are the candidate hosts; the broadband plan itself sets targets for connecting health centres. Picking the sites that together cover the most people in rural gaps is a maximal covering location problem. I solved it by lazy greedy selection over 75,124 candidate square kilometres holding 54,732 clinics and 204,355 schools, with a 5 km site reach, the low end of the 5 to 15 km range the ITU gives for mobile cellular. For this kind of problem, greedy selection is guaranteed to reach at least 63% of the best possible coverage.
The first 100 sites reach 3.12 M people, 47 of the sites at schools. Clinics alone would reach 3.04 M. How far one site reaches matters more than any other assumption:
Most people, or the poorest first?
The tool can choose sites to reach the most people, or to reach people in the poorer 40% first while still counting everyone covered. It opens on poorest first.
| Poorest first | Most people | |
|---|---|---|
| Everyone reached | 2.87 M | 3.12 M |
| People in the poorer 40% reached | 2.72 M | 2.33 M |
Choosing the poorest first reaches 398,000 more people in the poorer 40% for 251,000 fewer people overall. Which to prefer is a policy choice, so the tool shows both.
Places a ranking passes over
The LGAs with the most poorer rural people and no test (Ningi, Fune, Wasagu/Danko, Ganjuwa, Gamawa) are thinly settled, so a straight ranking passes them over: in four of the five, even the best single site reaches fewer people than the 100th site chosen. They need a budget line of their own.
Are the gaps real?
A missing test is missing evidence, not proof of no signal, so I ran two checks.
- 95.9% of the people in rural gaps had no test within 2 km in any quarter of 2024, so the gaps are not one quarter's chance.
- In OpenCelliD's crowdsourced map of mobile cells, 74.5% of the people in rural gaps have no cell of any kind within 5 km, against 3.9% in served areas.
DSN supplied the speed tests without saying which release they came from, so I matched them to Ookla's public files: all 9,234 tiles are identical to the mobile release for Q4 2024. A separate script then recomputes the published numbers by independent routes, such as brute-force counts and great-circle distances, and the current run passes 40 of 40.
What it doesn't claim
- Tests are crowdsourced, sparse and mostly urban, and 231 of 774 LGAs logged none in the quarter. The gaps come from where people test, not from operator coverage maps or mast locations.
- OpenCelliD is a second crowdsourced source, not an independent survey, and 99.95% of its Nigerian records are 2G. It shows where any mobile network has been recorded, not where 4G exists.
- The 2 km serving distance and the 5 km site reach are assumptions. The sensitivity runs in the repository show how the results move with them.
- The wealth estimates date from 2021, and a registered clinic or school is not always a working one. New sites also need power, backhaul and security, which this does not model.
What's public
The interactive tool, the full pipeline and the result tables are on GitHub, with a two-page summary. One command rebuilds every number, and each download is checked against a recorded checksum before anything runs. The code is MIT-licensed. Because Ookla's data is non-commercial and ShareAlike, the maps and tables are shared under CC BY-NC-SA 4.0.