Mapping where Amuwo-Odofin is most prone to flooding
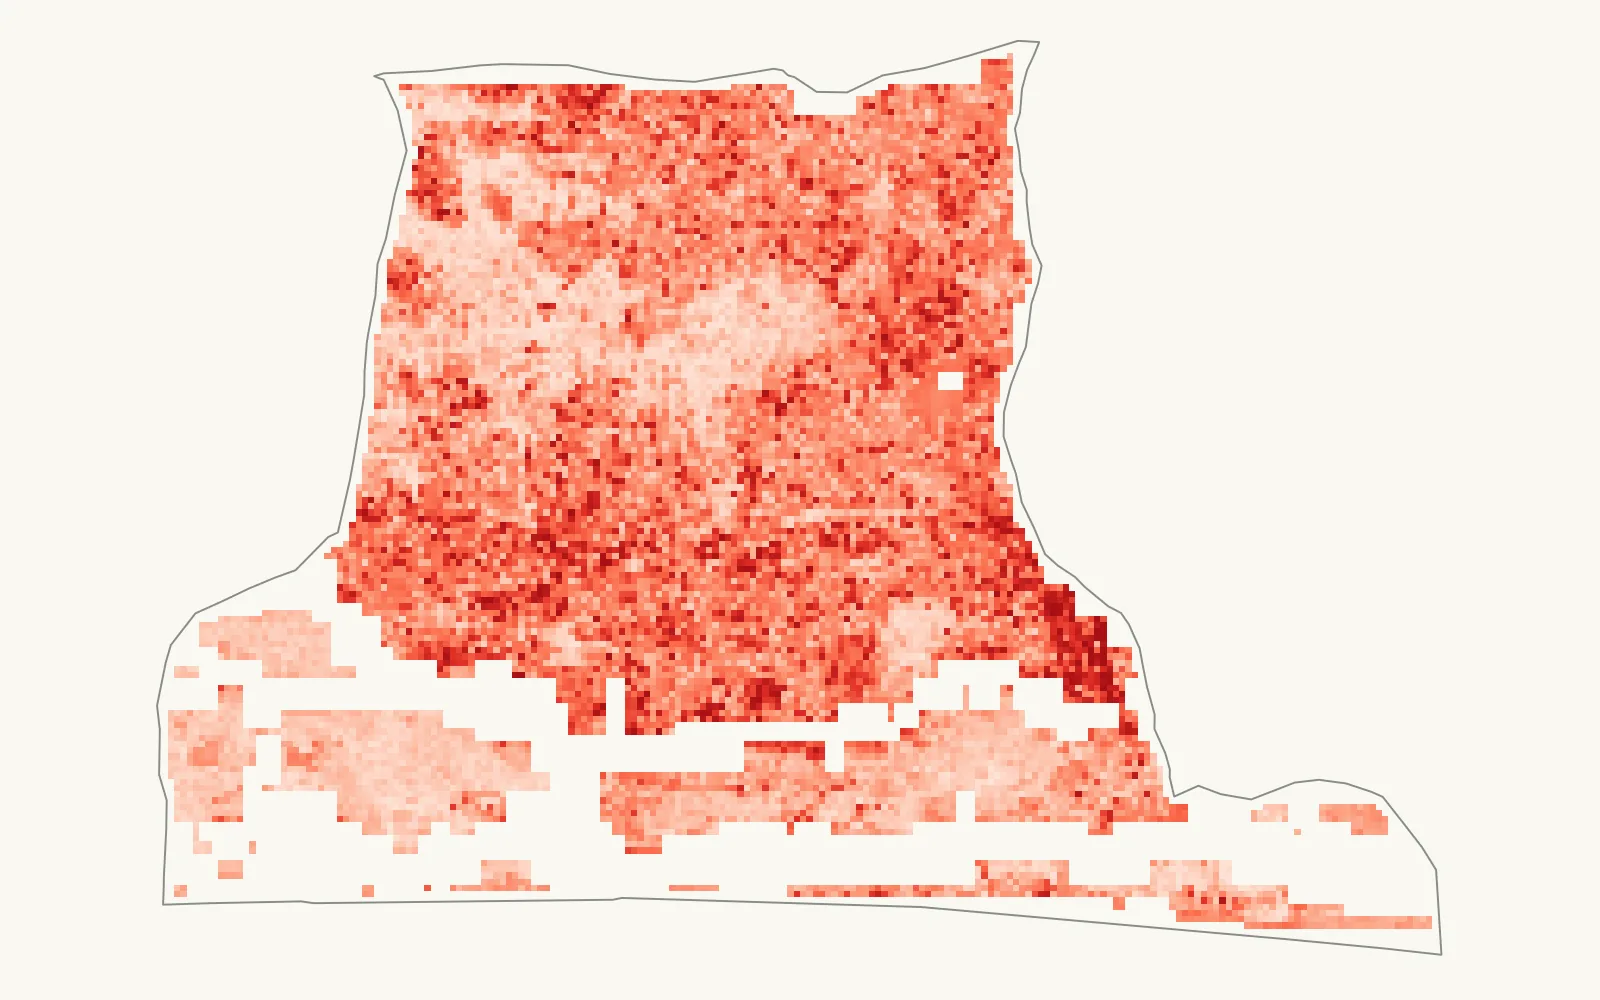
GeoAID is an open flood susceptibility model for one Lagos LGA. It shows where flooding is structurally more likely, why, and who is exposed. It also reports how well it holds up on ground it hasn't seen.
- Random-split ROC-AUC
- ≈ 0.798
- Spatial cross-validation
- ≈ 0.642
- Grid
- 100 m
- Flood events in training
- 4, 2017 to 2022
 Enlarge map
The question
Where in Amuwo-Odofin is flooding most likely, and why? Flood maps built on expert-assigned weights are often never checked against real floods, and they rarely explain why one place scores higher than another. GeoAID is trained on observed flooding and explains each prediction.
Three layers
- Structural susceptibilityWhere is inherently flood-prone? 14 satellite-derived factors feed a Random Forest that produces a four-tier risk map.
- Live activationIs that risk being activated now? Near-real-time rainfall from NASA GPM IMERG is compared against the risk map.
- ExposureWho and what is in the way? WorldPop population, and schools, health facilities and roads from OpenStreetMap, overlaid on the risk tiers.
Data and model
The flood record comes from Sentinel-1 radar across 4 verified Lagos flood events between 2017 and 2022, with masking to exclude permanent water. The conditioning factors cover terrain, rainfall, land cover, vegetation, soil and distance to drainage, all on a common 100 m grid.
A Random Forest was chosen over logistic regression and XGBoost. SHAP explains each prediction: vegetation cover is the strongest driver of susceptibility, which matches the model's own feature importance.
How good is it?
On a random split the model scores about 0.798. That number flatters it, because neighbouring cells in the training and test sets look alike. Under spatial cross-validation, where whole blocks of ground are held out, it falls to about 0.642. Plan with the second number. GeoAID can point to areas worth a closer look, but it shouldn't be the basis for a decision about a specific plot.
Catching a data error
An early version of the radar flood record marked 97.7% of the study area as flooded, because permanent water was leaking into the flooded class. After diagnosing and masking it, the flooded share fell to a physically credible 5.18%. That correction, and every other one, is written up in the methods log.
Limits
- Susceptibility is not a forecast. It shows where conditions make flooding more likely, not when a flood will happen.
- Two of the 14 inputs, both rainfall datasets, are coarser than the study area, which limits how much they can separate one place from another.
- The model is trained and tested for Amuwo-Odofin only. Whether it transfers to other LGAs has not been tested.
Preprint
Oyinloye, O. A. and Mustapha, I. O. (2026). GeoAID: An Explainable Geospatial Disaster Intelligence Framework for Urban Flood Risk in a Data-Poor Coastal Megacity. Preprints.org. doi:10.20944/preprints202609.1630.v1
Preprints have not been peer reviewed. GeoAID was built as my Master of Information Technology dissertation at Miva Open University.